
Page 63 - ZEB Final Report 2009-2017
P. 63
ZEB Facts and Figures | 63
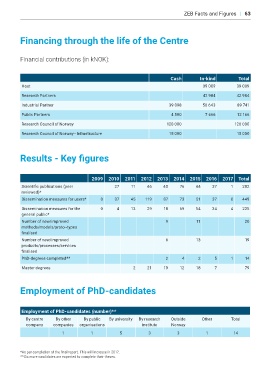
Financing through the life of the Centre
Financial contributions (in kNOK):
Cash In-kind Total
Host 39 009 39 009
Research Partners 42 984 42 984
Industrial Partner 39 098 50 643 89 741
Public Partners 4 500 7 666 12 166
Research Council of Norway 120 000 120 000
Research Council of Norway - Infrastructure 15 000 15 000
Results - Key igures
2009 2010 2011 2012 2013 2014 2015 2016 2017 Total
Scientiic publications (peer 27 11 46 40 76 44 37 1 282
reviewed)*
Dissemination measures for users* 0 37 45 119 87 73 51 37 0 449
Dissemination measures for the 0 4 13 29 18 69 54 34 4 225
general public*
Number of new/improved 9 11 20
methods/models/proto¬types
inalised
Number of new/improved 6 13 19
products/processes/services
inalised
PhD-degrees completed** 2 4 2 5 1 14
Master degrees 2 21 19 12 18 7 79
Employment of PhD-candidates
Employment of PhD-candidates (number)**
By centre By other By public By university By research Outside Other Total
company companies organisations institute Norway
1 1 5 3 3 1 14
*As per completion of the inal report. This will increase in 2017.
**Six more candidates are expected to complete their theses.